Portuguese Language Special Issue
Geovisualização de dados e ciência aberta e cidadã - a experiência da Plataforma LindaGeo

Introduction
The intensification of data production in large volume and in different areas, which has been characterized as a process of “datification” 1, as well as the various possibilities of use and implications deriving from it, have aroused growing interest in new visualization strategies and tools. Within the scientific environment, it is not only the “hard sciences” that seek to appropriate these new platforms when faced with the expansion and technical requirements of e-science (the so-called big data of science). This topic is also the object of experimentation and reflection by human and social sciences, fostering enriching synergy and interdisciplinary dialogue in joint applications and mutual learning.
This paper addresses a specific topic in this field, that is, data and information geovisualization as maps, discussing their possibilities and limitations in promoting the co-production of knowledge among different actors as well as in providing tools for social intervention in territorial ordering and development.
In the first part, we systematize, from a critical perspective, a set of key concepts, approaches and issues that guide the debate on the topic. We argue that strategies of visualization and the corresponding transformations in the technologies supporting them cannot be conceived as mere technical tools. They are permeated by power struggles between actors with different visions, knowledge bases and epistemic perspectives, constituting thus, more properly, sociotechnical infrastructures.
Subsequently, we discuss the role of participatory methodologies of social cartography within this setting, presenting a synthesis of the reflections derived from the experimentation with the development of a prototype of a geospatial open data platform as part of an open science action-research project carried out in the municipality of Ubatuba, on the Northern coast of the state of São Paulo, in Southeastern Brazil 2. It is noteworthy, in the context of disputes and controversies about the territorial re-ordering of the region, the relevance of the combination of participative methods and open tools in order to incorporate, in the production of the maps that define territorial use, social groups historically excluded from or disregarded by these processes. In the case of the region under study, they are the caiçara, indigenous people and quilombola communities, besides traditional fishermen and workers in general. These social groups hold strategic knowledge about the territory in which they live and about its resources, but do not have access to data or to the skills required to the use of technological tools for processing and geovisualizing this information.
Data and information visualization
Data and information visualization constitutes an auxiliary element for the presentation and communication of a set of data turning, for example, a textual or tabular representation of alphanumeric codes into a visual representation (graphs, maps, infographs, etc.). It can thus be defined as the “remapping of other codes into a visual code” 3, making them more accessible cognitively or intelligible.
Visualization enables the broadening of conditions for a better understanding of large amounts of heterogeneous data, besides facilitating sharing and using them, contributing towards exposing the information “that would otherwise be hidden (or we could say invisible) in data” 4. Compared to textual description which requires specific linguistic abilities for its understanding, given the diversity of languages, visualization through images has a more universal character, broadening the audience of data and information users.
The delimitation between data visualization and information visualization is not rigid: it varies according to the context and the type of interpretation 4. Information has been understood as the mediating element between data (the basic element) and knowledge 5 6; or yet as a means of registering or communicating knowledge 7 8. Therefore, it has a “relational character” that “only achieves a semantic value through selective and interpretative processes” 9. It relates to the idea of flux, of circulation, involving both material and subjective conditions. Thus, both the function and the formatting of data and information are inseparable 10.11
Visualization is influenced both by the perspective of the author (who produces it), as by the user or reader (who uses it), as well as by their respective competencies to carry out the visualization and to interpret it. In this sense, it is not neutral; instead, “strategies of visualization or visuality regimes impose a certain outlook; thus, a culturally constructed outlook, a language and a way of knowing that determine our way of being and of living our daily life” 12.
Use of maps for geovisualizing data and information
Maps are a mode of geoespatial information,13 a means of geo-graphic visualization of data and information, providing them with a spatial context and situating them within the territory. The elaboration of maps involves extensive work processes that encompass “from the initial collecting of data, to choices of how data are categorized and displayed, and on through the map´s ultimate dissemination and use” 14, expressing the social relationships and values of the societies where they are produced 15 16 10.
Their function cannot be reduced to defining a place in space through geographic coordinates (georeferenced data). Maps allow for “a specific way of seizing reality, that of languages aimed at the sight, at the point of view,” a way of apprehending “a world that is too complex for our eyes,” but, above all, “a world that is only available in the map” 17. While a symbolic-imagistic representation of a certain object or spatial phenomenon, maps are instrumental as cognitive assistants that help us to contemplate the different aspects of the territory.
Starting from the perspective of the social studies of science, Bruno Latour 18 considers maps as one among the possible forms of “inscription” that include also pictures, numbers, letters, graphs, among others, all of them to a certain extent consisting in means of visualization. They present to the onlooker, in a synoptic manner, heterogeneous things that are either absent or not perceptible, combining them among themselves in only one place in hybrid forms. To the author, they are immutable mobiles, as they simultaneously allow for mobility (they facilitate displacement and communication of what is being represented) and immutability (they confer stability to what is being represented).
Latour stresses that different forms of visualization (or of inscription) combine with one another, re-enforce each other and thus turn themselves into long “cascades” , allowing for the “overlapping of several images from different sources and of a different scale” 18. These successive re-combinations are facilitated nowadays by the homogeneous treatment of data made possible by digital technologies, as part of a “trend towards increasingly simpler inscriptions that mobilize increasingly larger number of events within a single point” 18. Therefore, the author proposes that differences in scale are not given or pre-existing, but are part of a production that involves different kinds and tools of visualization, expressive of power relations:
the globe is not, by definition, global, but is, almost literally, a model of scale […] we don’t have on one side the scientists benefitting from a globally complete view of the globe and, on the other, the poor ordinary citizen with a limited local view. There are only local views. However, some of us look at connected scale models based on data that has been reformatted by more and more powerful programs run through more and more respected institutions.
19
Therefore, to Latour, the relationship between visualization and cognition is not limited to its implications to human perception, but lies in its ability to mobilize , especially in situations of controversy and antagonism. According to the author, “inscriptions make recruitment possible!” 18. They intervene in the way we argue, provide evidence and believe, contributing to the convincing and recruiting of allies in the construction of facts20 — which “requires a huge effort of measurement, calculation, and definition” 14.
Thus, maps constitute a representation that not only disseminates and shares information, but also contributes to the affirmation and certification of a certain type and conception of knowledge, which, in turn, instrumentalizes a way of territorial intervention. Along these lines, it is argued that maps are highly selective in what they intend to show: “maps never simply convey information in a direct and unmediated manner, but instead they are invested with the ability to incorporate some forms of information while omitting others” 14. They express the point of view of the actors, “a variety of observational frames that cannot be divorced from their unequal positions within the very terrains that they seek to portray” 14. Therefore, they reflect power relations, as integral parts of political disputes about the territory and also exerting influence on public perception about these conflicts 16 21.
On the other hand, we would stress that while “it fixates the space of places, it locates, it distributes, it guides” , the map “preserves [for travelers] the way, the route on which they will learn with events the reading of themselves, of others and of their own space” 12. Thus, maps mobilize subjectivities. “The reading of maps follows a movement that produces experiences, practices, meanings besides those already constituted. They also trigger affects and perceptions, differences that traverse the inhabited space” 12.
Digitalization of geovisualization
Despite the fact that, in its more rudimentary forms of pictographic representation, maps historically preceded oral language and numerical systems, they only became widely available after the European Renaissance. From the 19th century on, with the complexification of geographical space and urban-industrial expansion, the need expanded for more detailed and precise description and representation with a view to better understanding and ordering of territory. “ Chamber cartography could no longer adequately represent a more sophisticated and more diversified territory upon which the State had to act and intervene in an efficient and realistic manner” 10. Initially, surveys and efforts of immersion in the territory through field work intensified. However, soon more complex and sophisticated technological solutions became necessary. These solutions would develop and become widespread throughout the 20th and 21st centuries.
The perception of maps as space representation tools and, therefore, as ways of storing geographic data about the territory was then extended to their role as instruments for the presentation and communication of any type of data and information. Digital mapping technologies have also expanded the uses of maps as devices that allow not only representation, but also the construction of new sets of data, information and knowledge 22. At the same time, the limitations of these uses by non-specialists were evident, as will be seen below. New information and communication technologies represented a fundamental turnaround in instruments and systems for surveying, processing and representing geospatial data and information. Noteworthy are digital cartography (particularly Geographical Information Systems — GIS) and remote sensory that pushed forward thematic cartography,23 as well as the different modes of representation and analysis of spatial data originating from this. 24 25.
Large scale production of data (datification) was pushed forward by the diffusion of the use of digital technologies 1. On the one hand, it is argued that digital cartography contributed towards the “de-materialization” of means of visualizing spatial data through the extended use of virtual environments 10. On the other, it is stressed that digital cartography “has rematerialized the whole chain of production — a chain that requires people, skills, energy, software, and institutions that all contribute to the constantly changing quality of the data ” 14.
Thus, new material and cognitive infrastructures are required to provide support for, from field work to the graphic designer as well as to the management of databases, in a continuous process of feedback and updating. The concept of infrastructure must not be naturalized, that is, be conceived as a transparent object with pre-defined characteristics, mere substrate or backdrop against which actions are carried out. “Infrastructure is a fundamentally relational concept. It becomes infrastructure in relation to organized practices” 26 (italics added). It is the case then to reflect upon these technological infrastructures as part of social arrangements, or better, as sociotechnical arrangements, articulated to other components and variables, in which “substrate becomes substance” 26. Within them, decision processes that express the power game between social groups with different points of view and interests are implicated.
From this derives the ambiguous or contradictory character of new technological platforms that push forward datification processes and open up new possibilities of data and information geovisualization and analysis. They enable the move from bi-dimensional, static and unidirectional visualization to tri-dimensional, dynamic and interactive shapes (considerably more sophisticated and complex than former terrestrial globes). In bi-dimensional and unidirectional visualization, point of view is fixed and information is ready, closed, a black box impossible to be explored, intervened with and contested by the user.
On the other hand, in the tridimensional, interactive and dynamic presentation it is possible to have a variation of perspective or of point of view, a “decentering” in relation to the object, allowing also “the observer to walk through the representation of the geographic space in a way similar to the flexibility he/she enjoys to walk about the geographical space of the external world” 10. It is possible to navigate through different visual levels (zooms) and to combine different sets of data (or themes), adjusting them to specific needs. At the same time that they become more complex and sophisticated, these new platforms of visualization become potentially less abstract, more playful and friendlier. They enable more intelligent and effective connections between the symbolic-imagistic mental representation of space and its formal-conceptual representation in the shape of geospatial data and information which, in principle, broadens the perceptual experience and the resulting interpretative capacity 10.
New computational technologies for producing interactive digital maps are seen as a means towards a relative democratization of cartography as they enable the availability and the access to spatial data and to software of online visualization, and as they blur the borders between the roles of producers and readers/users of these data and information, mobilizing their experience and their specific knowledge. They facilitate the collaborative production of data and information, as well as the incorporation of different perspectives and points of view, which potentially makes these systems stronger and more democratic – scientifically and politically.
The combination of these tools with recent movements in favor of open data27 28 expands their democratic potential. Beyond access, the availability of data in formats and means (through web services) is required, allowing for their reconstruction and re-utilization and hence, for the freedom and greater autonomy to explore and analyze them. Even though new cartographic technologies and geovisualization tools still are privately owned and of high cost, dominated by North-American and European corporations, the open source movement is expanding in the field of cartography and geo-information. This movement has made accessible and popularized (1) the use of Geographic Information Systems (GIS) and (2) applications for the collection and availability of data on web platforms that enable the visualization of spatial data.
In the first case, GIS with functionalities and extensions for manipulating vector and matrix data as well as for spatially referenced data analysis that support the expert user stand out. Some examples are: Quantum GIS (QGis) and gvSig (originated in communities and collaborative associations such as OSGEO and gvSIG); and Brazilian initiatives, such as Spring, TerraView and TerraME (developed by the National Institute for Space Research - INPE).
In the second case, there are applications and platforms that enable collaboration between users in different locations, providing geographical information that will be added and consolidated in a single online environment, where they will be available through web viewers (Web GIS) and services. Among the platforms known as collaborative mapping, the Open Street Map stands out for its active community and worldwide reach. Among the Web GIS, i3Geo (developed by the Brazilian Ministry of the Environment and later maintained by the Ministry of Health), GeoNode and GeoNetwork stand out. The latter two, despite being platforms more focused on data and metadata exchange, which are today strongly linked to the concept of SDI (Spatial Data Infrastructure), have in recent years sought to increase their ability to provide tools for data visualization.
With regard to GIS installed locally on users’ computers, its ability to perform more complex operations and in-depth analysis of data sets stands out, since it is not subject to network or server processing limitations. In the case of Web GIS, which is available through Web servers, the existing functionalities tend to be limited to the characteristics of a networked system, subject to data traffic issues and concurrent processing. However, as the technology evolves, the differences between the Desktop (local, dedicated) and Web (on the network, shared) environments, their limitations and potential, tend to decrease, as well as the differences between the functionalities found in the Web GIS and those available on Desktop.
Table 1 below presents a synthetic description of these platforms and tools, as well as links to sites with more detailed information.
Platforms/Systems of open geospatial data Platform Description Type QGIS – Quantum GIS Project of the Open Source Geospatial Foundation (OSGeo) of a system of free and open geographical information that offers for free functionalities commonly found in proprietary software such as: visualization, editing and analysis of geospatial data and information as well as the creation and printing of maps. Desktop GIS software with online map interface Spring Geographic Information System developed by Inpe, aimed at incorporating the state-of-the-art in image processing, spatial analysis, numerical modeling of terrain and consultation of spatial databases. It seeks to provide an easy-to-learn, unified GIS geoprocessing and remote sensory environment for urban and environmental applications. Desktop GIS software TerraView Application developed by Inpe, built by using the TerraLib library, containing the main functions of a GIS for visualizing matrix and vectorial data, managing a geographic database built upon different managerial devices, map vectorial algebra, image processing, vectorial editing, printing of cartographic products, among others. Desktop GIS software TerraMA Developed by Inpe with open software, with extensive use of TerraLib geographical library, to meet a growing demand for environmental monitoring applications. It is based on an open architecture of services that provide the necessary technological infrastructure to the development of operational systems aimed at the monitoring of environmental risk alerts. Desktop GIS software GvSIG A Project that calls itself “the largest network of professionals of free geomatics”, consisting basically of a set of applications that guide and facilitate the whole geo cycle of information, from its collection in the field through analysis and editing, up to its dissemination in Spatial Data Infrastructures (SDI). Desktop GIS software with online map interface i3Geo Application to access and analyze geographical data using the web, based upon free software, especially MapServer. It was developed by the Ministry of Environment and distributed under the GPL license (General Public License), aimed at disseminating the use of geoprocessing as a technical-scientific tool and at implementing a generic interface for the access of geographical data to be found at public, private or non-governmental institutions. WebGIS platform Open Street Map A project of world mapping in a collaborative way, according to the concept of Voluntary Geographic Information (VGI), with a focus on community participation, local knowledge, technology for collecting geographical coordinates using the Global Positioning System (GPS), satellite images etc., and adherence to the open data principles Collaborative WebGIS platform GeoNode Web-based open platform and application for the development of geospatial information systems (GIS) and for the implementation of spatial data infrastructures (SDI). WebGIS platform GeoNetworks Free and open source cataloging application (FOSS) for georeferenced resources. It is a catalog of location-oriented information. WebGIS platform
All these platforms have a common objective with a few variations: to make possible ample access by individuals and communities through the use of functions of image processing, spatial analysis, the consultation of spatial databases to access data and information on the territory as well as interfaces with applications for collecting coordinates and Global Positioning System (GPS) devices. They also make possible the adherence to principles of open data, encompassing analysis (spatial or otherwise) and editing, to their dissemination through Spatial Data Infrastructures - SDI29
On the other hand, we would like to stress that the availability of data in open access and format does not ensure by itself their democratization or social appropriation; usability is also crucial, requiring the development of the competencies of users: “too much emphasis is given to the data supplier and only limited attention for the user […] the main challenge is that open data has no value in itself; it only becomes valuable when used” 30.
Besides, it is evident that the new systems of tridimensional and dynamic geoprocessing and geovisualization of data and information may also contribute, in reverse, to strengthen the unilateral dominance of the perspective of the author of the data and of the information, as well as of visions and discourses expressing particular and dominant interests over the space and territory. By facilitating and emphasizing statistical and quantitative analyses on the territory, attributing value to them as a means of objective representation of the materiality of space 14, these computational platforms also contribute to the disregarding and abating of other more qualitative and subjective aspects. Therefore, they can strengthen reductionist conceptions that equate knowledge to the capacity of generating and organizing a significative volume of data and information in a structured manner. In summary: “virtualized geographic knowledge of the territory in these potentialized systems of geographical information acquires such great authority that their presentation ends up by becoming the evidence of reality, despite the fact that it is only a hypothesis of knowledge, built within the scope of the modelling of an information system” 10.
Thus, the concern arises that the new computational resources for surveying and visualizing territorial data might excessively strengthen the role of specialists of these tools in determining “our image of the world”, decreasing the importance of field work 15. On the other hand, it is argued that “despite the proliferation of drones and satellites, […] ground data collection is still central to digital cartography” 14, as a means of both validation and of interpretation of what is seen from a distance.
Social cartography and the open science experience of the LindaGeo platform
Social cartography approaches have attempted to establish a counterpoint to the utilization of maps as instruments of power affirmation of hegemonic social groups. Social cartography consists of carrying out the process of mapping according to the point of view of the participant or social group on their own world, their surroundings and corresponding social contexts. At a first instance, its purpose is to represent the daily life of a community according to its own vision, incorporating, in a second instance, the concepts and techniques of cartographical mapping, such as the role and scope of scale, detailed spatial location and legend of what is being represented/ mapped 21. To this end, one resorts increasingly to the new digital tools and platforms of geovisualization.
In Brazil, social cartography has been most frequently used in the Amazon region 31 21 32, expanding to other regions 33 34 35 36 25, as a strategy towards the affirmation of territorial rights and the transformation of social demands into public policies, through the use of different processes of participative mapping.37 One aspect that has been stressed is the centrality of the role the communities themselves can and must play in directing the mapping of their territories in order to strengthen their points of view and to ensure protagonism in claiming their rights 38 32 34.
The action research project Ubatuba Open Science39 has developed a prototype to test the participative production of a geovisualization platform in that territory, as part of the investigation of the role of open and citizen science40 in local development strategies. The notion of open science adopted by the project referred not only to the opening within the restricted field of scientists, but also to the increased porosity and interlocution of science with other types of knowledge 2. Along the same lines, a less instrumental type of citizen science was adopted with regard to the contribution of non-specialists and more horizontal or democratic in the perspective of the co-production of knowledge involving both scientists and non-scientists 41.
Named LindaGeo - Northern Coast Geospatial Open Data (see Albagli et al. 2019), the geovisualization prototype had, as a focus of experimentation, the discussions started in 2014 around the revision of the Economic-Ecological Zoning of the Northern Coas of São Paulo (EEZ-NC),42 established in 2004 in order to promote territorial ordering and to discipline the use of the region’s natural resources.
Along the revision of the EEZ-NC, a consultation process was conducted by a Working Group constituted by the Municipal Council of the Environment, with the purpose of obtaining subsidies for its revision as well as to enlighten local communities, particularly the most affected ones and with little information about the process. Meetings and public audiences were held, both at the regional and local levels in different neighborhoods, revealing the existence of local groups highly mobilized to claim their rights of territorial use.43
On the one hand, public audiences brought to light the existence of divergences and conflicts of interest of and perspectives among the different actors – such as representatives from both the municipal and state governments, Federal and State attorneys, representatives from businesses, traditional communities, environmental organizations, among others – about the different uses of the territory, its natural resources and its local cultures. On the other hand, it also became evident that the local groups’ lack of qualified information concerning the procedures related to the revision of the EEZ, the significance of each delimited zone (terrestrial, marine and stretches between tides), as well as of the allowed and forbidden uses 44 45. This fact had direct repercussion on the quality – and consequently on the reach – of the claims presented by these groups.
Along this process, local communities expressed a constant discomfort, particularly the traditional populations (indigenous peoples, quilombolas and caiçaras), because they felt that the way consultations were conducted was not sufficiently participative and informative, privileging and legitimizing points of view based on what was considered “reasoned technical criteria”. Local communities also questioned the truthfulness of the information expressed in official maps presented by the EEZ revisions 44. Traditional communities expressed a clear interest in taking part in the mapping of their own territory, according to the report of a representative from the Traditional Communities Forum, which encompasses the municipalities of Angra dos Reis, Paraty and Ubatuba:
We have to sit down together in order to draw the map and to be acknowledged by the map, and not only allow the government to do it…
(leadership of the Traditional Communities Forum - FCT) 44
Thus, when developing LindaGeo, different local groups were mobilized, involved and exchanged experiences, such as, the Northern Coast Hydrographic Basin Committee, the Protected Area of the Marine Environment, local schools, University researchers, besides members of the Traditional Communities Forum and of the Bocaina Observatory of Healthy and Sustainable Territories (OTSS).46
Tests and workshops were carried out on an online platform, developed with free software – Geonode, Geoserver and Geonetwork – in order to produce collaboratively and to share geospatial data47 . Geonetwork and Geoserver were chosen because they are free software adhering to the standards of the Open Geo Consortium (OGC)48 and because they are present in the majority of the Spatial Data Infrastructure built in Brazil. Geonetwork is a catalogue of metadata that allowed the identification, the disclosure and the access to a set of data identified in the context of the project. Geoserver was used for the dissemination of data and information that, up to then, were available only in files stored in local devices, through web services meeting standards defined by OGC. As to Geonode, it was used as a geovisualizer of data and information on the territory.
It was established that the selected software met the objective of offering visibility, knowledge and use to available data and information to those local agents. However, for the use of these software to be effective, considering the diversity of participants and the different demands of the communities involved, it was necessary to devise the structure of a task that involved training and tutoring in order to make possible the fulfilment of the multiple use of these platforms by local groups. Other visualization platforms available were also tried out together with Geonode, such as the Quantum GIS platform, besides proprietary platforms such as Google Earth49 and ArcGIS/ESRI.50
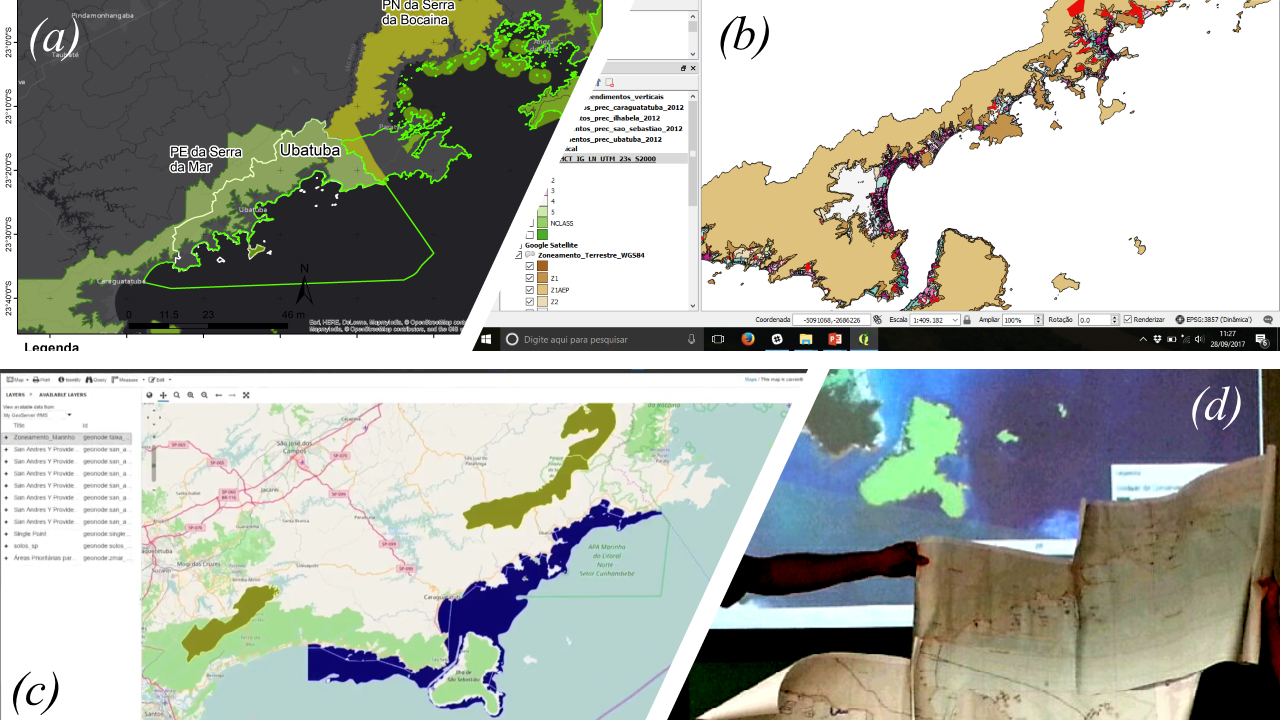
Visualization of the territory of the Northern coast of São Paulo using different platforms. (a) Conservation units in ArcGIS online; (b) overlapping of EEZ-NC and precarious settlements in QGIS; (c) marine EEZ-NC in Geonode; (d) Ilhabela State Park on Google Earth. Source: Records from the Ubatuba Open Science Project in meetings of the LindaGeo group during the period of 2016-2017[^36] .
It was also possible to establish the functionalities and limits of the adopted software as well as the need to collectively construct certain protocols. The experience showed that, with the tools and resources then available, even trying to make them more ludic and friendlier, it was difficult to carry out a process of joint construction and representation of their own reality by the participants.
Still under experimentation, a strategy the group has sought is to draw another prototype, involving schools and/ or universities in the co-construction of a Geotechnology Laboratory (LabUbaGeo), with High School and post-High school students, in such a way that the project become part of a continuous pedagogic program in the region.
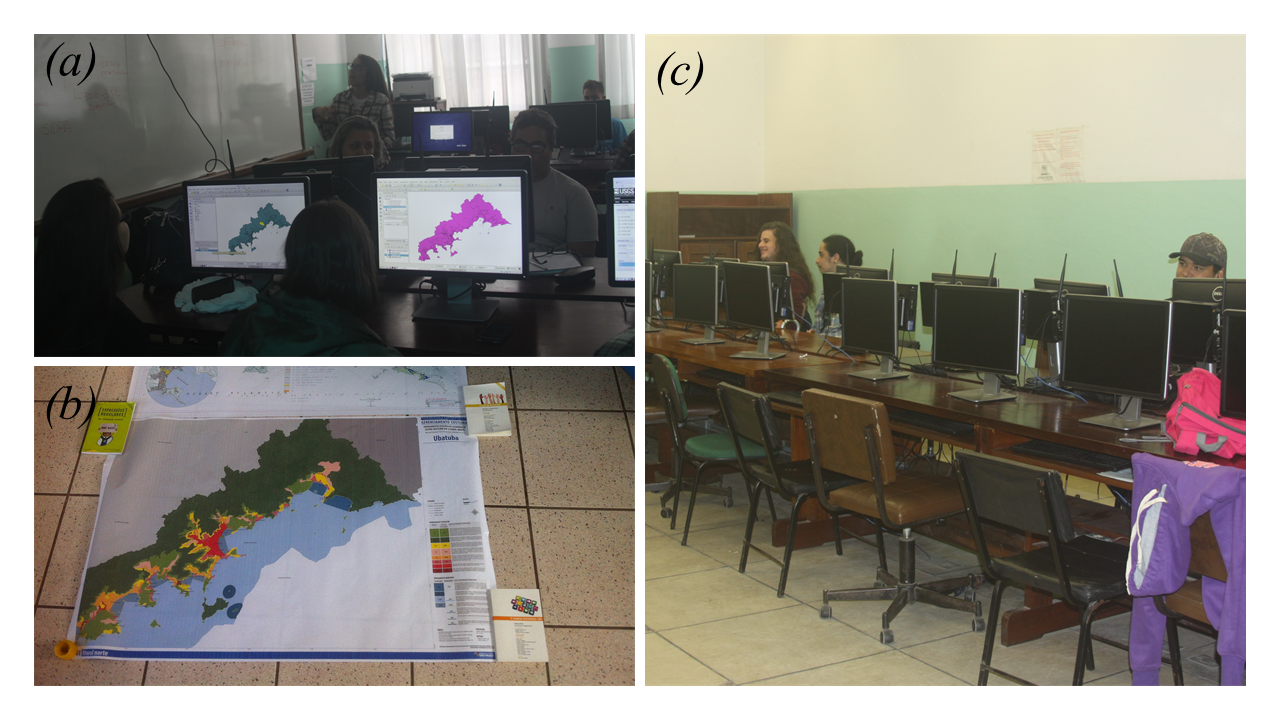
Activities carried out in the computer lab (LabUbaGeo) of the Tancredo Neves state school in Ubatuba. (a) QGIS workshop offered by INPE researchers; (b) visualizing printed maps of the currently in use EEZ-NC (2017) and Ubatuba directory plan; (c) computer network and High school students.
Finally, it is worth pointing out that the very discussion about the maps involving different interested local groups and communities is, in itself, a result of the project, encouraging collective thinking about territory on the basis of existing data and encouraging a critical view of what is represented and of the geovisualization tools themselves. The development of a critical perspective about the processes of elaboration and uses of maps by local groups was undoubtedly an important positive outcome of the experience. After all, how to enable different local groups to make use of the different sets of data available remains a key issue to be solved.
From the perspective of this paper, among the various challenges identified towards the implementation of the platform, the following aspects stand out: the importance of setting up a governance system among groups and institutions, according to their different levels and types of participation; the need to structure a multidisciplinary team, involving from information technologists to researchers in the areas of sociology, geography, remote detection and cartography; the definition of a protocol for using data, according to the specificity of each one of the institutions involved; carrying out activities and training in methodologies of social cartography.
Conclusions and Future Projects
By intending to produce objective scientific facts about territory and as a means of inscription that seeks to consider as truthful the information and data they represent, maps act directly upon the modes of producing space, as well as on how it is appropriated, as a consequence historically becoming a tool in the exercise of power. In this sense, cartography must be understood “as a practice both political as scientific” 14, a characterization that must be extended to the new tools and infrastructure of geovisualization that open up new opportunities, but also create obstacles to the broadening the social basis of knowledge and intervention on territory.
AParticipative approaches and methodologies seek to confer value to and to practice more varied ways of representing territory in order to integrate mapping, (self-) organization and the knowledge of local populations 51 52 53. To this end, they have adopted new digital tools and platforms of visualization. However, it is necessary to open the black box of these platforms, particularly by democratizing the role played by the author or group of authors of the data when they impose their own perspective, which represents a limited and particular view of the territory.
Strategies of social cartography associated with approaches of open and citizen science can potentially offer a significant contribution towards this end. Beyond the problem of access, it is the case of bringing into question who, how and what type of knowledge is produced – and frequently imposed on territory.
Throughout the development of the prototype of the LindaGeo Platform, it became evident how inequality in access to information and associated technologies is reflected on unequal conditions of participation and intervention in decision processes as indicated in other studies 54 55 21. At the same time, the limits that the access to these infrastructures can generate in the democratization of public policies and interventions in the territory are demonstrated. It became evident that the participative production of the map does not ensure that the opinions expressed there be considered by official governance systems.
On the other hand, within a short period of experimentation, it was noticed that the region has great potential to follow up the initiative, articulating collaborative actions of geovisualization with efforts of sharing and opening data about the territory. The synergy due to this work resulted in the development of an experience of common interest, with the expansion of the working party, the identification of new partners56 and the acknowledgment of the relevant scientific production.57 In 2018, the group succeeded in gathering together at least 12 institutions from different sectors and around 60 members interested in unfolding LindaGeo as a structured, long-term action (http://wiki.ubatuba.cc/doku.php?id=linda:linda), including managing councils of hydrographic basins and Conservation Units, non-governmental organizations as well as teaching and scientific research institutions.
Thus, as important as the creation in that region of an open data platform of spatial information, the LindaGeo must become an infrastructure for a socially engaged continuous process of dialogue and reflection about power relation, knowledge and participative management of territory.
Acknowledgments
The research project resulting in this paper was made possible by the financial support of the National Council for Scientific and Technological Development (CNPq), of the Carlos Chagas Foundation for the Support of Research in the Rio de Janeiro State (Faperj, Project E-26/ 202.413/2017) and of the Open and Collaborative Science in Development Network (OCSDNet), with resources from the International Development Research Center (IDRC), Canada.
Mayer-Schönberger, V., Cukier, K.. (2013). Big Data: a revolution that will transform how we live, work, and think . Boston: Houghton Mifflin Harcourt. ↩︎ ↩︎
Albagli, S., Parra, H., Fonseca, F., & Maciel, M.L. (2019). “Open Science and Social Change: A Case Study in Brazil.” In: Leslie Chan, Angela Okune, Becky Hillyer, Denise Albornoz, Alejandro Posada (Orgs.). Contextualizing Openness: Situating Open Science . Ottawa: University of Ottawa Press. Disponível em: https://www.idrc.ca/en/book/contextualizing-openness-situating-open-science. ↩︎ ↩︎
Manovich, L. (2010). “What is visualization?” paj 2.1: The Journal of the Initiative for Digital Humanities, Media and Culture. , v. 2, n. 1. Disponível em: https://journals.tdl.org/paj/index.php/paj/article/view/19. Acesso em 1 abril 2018. ↩︎
Boechat, M.P. (2015). “Visualizar, descobrir e compartilhar: sobre os usos da visualização de informação para construir espaços compartilhados para o debate, os casos do jornalismo de dados e da cartografia de controvérsias.” Tese de Doutorado. Escola de Comunicação, Universidade Federal do Rio de Janeiro, Rio de Janeiro. ↩︎ ↩︎
Machlup, F. (1962). The Production and Distribution of Knowledge in the United States . Princeton, NJ: Princeton University Press. ↩︎
Nonaka, I., Takeuchi, H. (2008). Gestão do conhecimento . Porto Alegre: Bookman. ↩︎
Saracevic, T. (1992). “Information Science: origin, evolution and relations” . In: Vakkari, P. & Cronin, B. (Ed.). Conceptions of Library and Information Science . London: Taylor Graham. pp. 5-27. ↩︎
Wersig, G. (1996). The information service of the 21st Century . SungKyunKwan University, Seoul, Korea. Disponível em: http://www.kommwiss.fuberlin.de/439.html. Acesso em 24 jul. 2007. ↩︎
González de Gómez, M.N. (1999). Da política de informação ao papel da informação na política contemporânea . Revista Internacional de Estudos Políticos, Rio de Janeiro, ano 1, n. 1, UERJ/NUSEG, pp. 67-93. ↩︎
Castiglione, L. H. G. (2009). “Epistemologia da geoinformação: uma análise histórico-crítica” . Tese de Doutorado. Programa de Pós-Graduação em Ciência da Informação, Niterói, Universidade Federal Fluminense. ↩︎ ↩︎ ↩︎ ↩︎ ↩︎ ↩︎ ↩︎ ↩︎
Castiglione also mentions Araújo (1994) who reminds us that “the word information comes from the Latin word informare: to form, to shape or to create, but also to represent, to present, to create an idea or notion – something that is ordered” (Araújo quoted in Castiglione 2009). ↩︎
De Aguiar, L.M. B.(2010).. “Para que serve a educação geográfica?” Disponível em http://www.ufsj.edu.br/portal2-repositorio/File/vertentes/v.%2019%20n.%201/Ligia_Aguiar.pdf, acesso em 15 de agosto de 2017. ↩︎ ↩︎ ↩︎
According to Castiglione (2009, p. 158), “the terms geoinformation, geographical information, georeferenced information and geospatial information are generally employed as different signifiers which, nevertheless, refer to the same signified, even though some currents of thought on the subject matter consider that the term geospatial information refers to a broader, almost generic concept of georeferenced information” 10. ↩︎
Bier, J. (2017). Mapping Israel, Mapping Palestine: how occupied landscapes shape scientific knowledge. ↩︎ ↩︎ ↩︎ ↩︎ ↩︎ ↩︎ ↩︎ ↩︎
Harley, J.B. (1989). Desconstructing the map . Cartographica, v. 26, n. 2, pp. 1-20. ↩︎ ↩︎
Crampton, J.W. (2001). “Maps as Social Constructions: Power, Communication and Visualization” . Progress in Human Geography , v. 25, n.2, pp. 235-252. ↩︎ ↩︎
Fonseca, F.P. (2014). A Cartografia no Ensino: Os Desafios do Mapa da Globalização . Revista do Departamento de Geografia, n. spe, pp. 141-154. ↩︎
Latour, B. (1990). Drawing things together . In: Lynch, Michael; Woolgar, Steve (Ed.). Representation in scientific practice. Cambridge: MIT Press. pp.19-68. ↩︎ ↩︎ ↩︎ ↩︎
Latour, B. (2011). “Waiting for Gaia. Composing the common world through arts and politics.” A lecture at the French Institute, London, November 2011 for the launching of SPEAP (the Sciences Po program in arts & politics) Bruno Latour, Science Po Disponível em: http://www.bruno-latour.fr/sites/default/files/124-GAIA-LONDON-SPEAP_0.pdf. Acesso em 28 abril 2018. ↩︎
To Latour, scientific facts result from collective constructions that involve the “recruitment” of different allies, from peers in the scientific community to organizations for policies and incentive of research 58. ↩︎
Acselrad, H. (org.) (2008). Cartografias Sociais e Território . Rio de Janeiro, IPPUR/UFRJ. 168p. ↩︎ ↩︎ ↩︎ ↩︎
Py, H.S. (2019). “Visualização de dados por meio de mapas e participação como recursos para a semocratização dos dados e para a apropriação social da informação.” Tese de Doutorado em Ciência da Informação. Rio de Janeiro: PPGCI/IBICT-UFRJ. ↩︎
A type of cartography based on the elaboration and use of thematic mapping (ground maps, environmental zoning maps) involving the collection, analysis, interpretation and representation of information in a base map, making use of graphic symbology (size, form, value, grain, color) for its representation. ↩︎
Câmara, G., Davis.C., Monteiro, A.M., D’Alge, J.C. (2001). Introdução à Ciência da Geoinformação . São José dos Campos, INPE, (on-line, 2a. edição, revista e ampliada). ↩︎
Marchezini, V., Iwama, A.Y., Andrade, M. R. M., Trajber, R.; Rocha, I., Olivato, D. (2017). “Geotecnologias para prevenção de riscos de desastres: usos e potencialidades dos mapeamentos participativos” . RBC. Revista Brasileira de Cartografia , v. 69, pp. 107-128. ↩︎ ↩︎
Star, S.L., Ruhleder, K. (1996). “Steps toward an ecology of infrastructure: design and access for large information spaces” . Information Systems Research . v. 7, n. 1. pp. 111-134. ↩︎ ↩︎
he expression open data has been commonly used to refer to the transparency of government data. In the field of science, it refers to the publicization of the primary data of a research project, which is considered a fundamental step towards its reproducibility and re-use, besides allowing for broad scrutiny. It can also contribute towards exposing inconsistencies, low quality, plagiarism or fraud. ↩︎
Machado, J. “Open data and open science.” In: S.Albagli, M.L. Maciel, A.H. Abdo. Open Science, Open Issues . Brasília: Ibict, Rio de Janeiro: Unirio. pp. 189-214 Disponível em: http://livroaberto.ibict.br/handle/1/1061. Acesso em: 4 maio 2018. ↩︎
“The term Spatial Data Infrastructure is frequently used to denote a basic set of technologies, policies and institutional arrangements that facilitate the availability and access to spatial data” 59. ↩︎
Janssen, M., Charalabidis, Y. & Zuiderwijk, A. (2012). “Benefits, Adoption Barriers and Myths of Open Data and Open Government” . Information Systems Management (ISM) , vol. 29, no.4. pp. 258-268. ↩︎
Almeida, A.W.B., Shiraishi Neto, J., Martins, C.C. (2005) “Quebradeiras de Coco Babaçu - Piauí” . São Luís, MA: Projeto Nova Cartografia Social da Amazônia / Editora: UFAM. Disponível em: http://novacartografiasocial.com.br/fasciculos/. Acesso em 4 maio 2018. ↩︎
Acselrad, H. (org.). (2013) Cartografia social, terra e território . Rio de Janeiro, IPPUR/UFRJ., 318p. ↩︎ ↩︎
Carpi Jr., S., Leal, A. (2011) Mapping environmental risks as tool of participatory plan in hydrographic basins . In: Bilibio, C., Hensel, O., Selbach, J. (Org.). Sustainable water management in the tropics and subtropics - and case studies in Brazil. Jaguarão/Kassel: Fundação Universidade Federal do Pampa UNIKASSEL PGCUlt-UFMA, v. 2, pp. 225-248. Disponível em: http://goo.gl/NxcKwx. Acesso em 4 maio 2018. ↩︎
Gorayeb, A., Meireles, A.J.A, Silva, E.V. (2015) “Princípios básicos de Cartografia e Construção de Mapas Sociais” . In: Gorayeb, A., Meireles, A. J. A., Silva, E. V. (Org.). Cartografia Social e Cidadania: experiências de mapeamento participativo dos territórios de comunidades urbanas e tradicionais . Fortaleza: Expressão Gráfica Editora, pp.9-24. ↩︎ ↩︎
Simões, E., Navarro, F.C.S., Bussolotti, J., Alves Junior, J.I. (2016). Planejamento Ambiental da Bacia Hidrográfica do Ubatumirim - instrumento de justiça socioambiental . 1ª. ed. São Paulo: Páginas & Letras, 114 p. ↩︎
Fujii, L.C., Pereira, B.F., Simões, G.S., Takahashi, E.H., Ribeiro, V.C., Cardoso, B.T., Iwama, A.Y., Medeiros, L.C.C. (2017). “Projeto Cachoeiras 2.0 - Uma metodologia participativa ao longo do Rio Paraíba do Sul” . In: Brahve - 1st Brazilian Workshop on Assessment of Hazards, Vulnerability, Exposure and Disaster Risk Reduction . Anais…, pp.1-5. Disponível em: http://www.cemaden.gov.br/wp-content/uploads/2017/08/Fujii_eixo4_poster.pdf. Acesso em 4 maio 2018. ↩︎
he focus has been on attributing the main role to the perceptions of local communities, such as the quilombolas, fishermen, extractivists and periphery groups, acknowledging and strengthening their points of view regarding topics such as protected areas, disasters, hydric resources and hydrographic basins, among others. ↩︎
Knapp, F.L. (2007). “Making Maps that Make A Difference: A Citizens’ Guide to Making and Using Maps for Advocacy Work” . International Rivers (Org.): Oakland, USA. Disponível em: http://www.internationalrivers.org/resources/making-maps-that-make-a-difference-4000. Acesso em 4 maio 2018. ↩︎
This is a Project coordinated by the Brazilian Institute of Information in Science and Technology (IBICT) from 2015 to 2017, as part of the Open and Collaborative Science in Development Network – OCSDNet www.ocsdnet.org ), with the financial support of IDRC/Canada. Project documentation can be found at http://cienciaaberta.ubatuba.cc/ and https://pt.wikiversity.org/w/index.php?title=Pesquisa:Ci%C3%AAncia_Aberta_Ubatuba ↩︎
Open Science means that scientific knowledge should be used, re-used and distributed freely by people with no legal, technological or social restrictions. The open Science movements began around open access to scientific publications and expanded in different directions, among which: open research data, open hardware, open research tools and citizen science. Citizen science encompasses the contribution and participation of non-scientists to scientific research. ↩︎
“Albagli, S. Ciência aberta em questão” (2015). In: S.Albagli, M.L. Maciel, A.H. Abdo. Open Science, Open Issues . Brasília: Ibict, Rio de Janeiro: Unirio. Disponível em: http://livroaberto.ibict.br/handle/1/1061. Acesso em: 4 maio 2018. ↩︎
Ecological- Economic Zoning (EEZ) consists in a “political and technical instrument for planning whose ultimate goal is to optimize the use of space and public policies” 60. EEZ presupposes four fundamental political axes: 1) territorial knowledge and understanding; 2) ecological and economic sustainability; 3) democratic participation and 4) institutional articulation. ↩︎
Discussions taken place during these meetings were accompanied and registered by the Project team; their results were incorporated into reports and publications. During this process, around 60 proposals were received, 35 from traditional communities (indigenous communities, caiçaras, quilombolas), through which 156 requests for modification or continuity of inclusion within specific zones 44. ↩︎
Iwama, A.Y., Silva, D.S., Ballabio, T.A., Fonseca, F.S.(2017). “A Participação no Zoneamento Ecológico-Econômico no Litoral Norte de São Paulo: como estamos nesta discussão?” . Informar Ubatuba . pp.1-6, Disponível em: http://informarubatuba.com.br/participacao-no-zoneamento-ecologico-economico-no-litoral-norte-de-sao-paulo-como-estamos-nesta-discussao/. Acesso em 30 abril 2018. ↩︎ ↩︎ ↩︎ ↩︎
Iwama, A.Y, Delgado, L.E. “Participación Comunitaria en Procesos de Decisión en la Conservación del Territorio, Cuadernos del Pensamiento Crítico Latinoamericano” . Clacso . pp.1-5, 2018. Disponível em: https://www.clacso.org.ar/libreria-latinoamericana/libro_por_programa_detalle.php?id_libro=1372&campo=programa&texto=19. ↩︎
OTSS is a local initiative in partnership with the Oswaldo Cruz Foundation (Fiocruz) which has sought to develop actions to secure the rights of indigenous communities, quilombolas and caiçaras existing in the region, relating to the uses of territory, culture and to quality of life. It developed strategies to confer visibility to these communities, including a Google Maps platform — http://otss.org.br/mapas/. ↩︎
http://wiki.ubatuba.cc/doku.php?id=cienciaaberta:encontro160808 ↩︎
The Open Geospatial Consortium (OGC) is a non-profit international organization oriented towards the creation of quality standards open to the global geospatial community. The consortium currently encompasses more than 525-member organizations and its proposed standards are used in a variety of areas, including geoscience and the environment; defense and intelligence; intelligent cities; the Internet of Things (IoT) and Sensors, mobile technologies; emergency responses and disaster management; aviation; energy and utilities, among others. Adherence to OGC standards favors interoperability between different technologies including proprietary ones. Available at: http://www.opengeospatial.org/. Accessed on 29 Jan., 2019. ↩︎
The Google Earth platform, developed by Google, allows users to visualize and to use different contents, including map and terrain data, images, information on businesses, traffic, evaluations as well as other information provided by Google - https://www.google.com.br/earth/download/gep/agree.html ↩︎
ArcGIS Online is an online collaborative web SIG, developed by ESRI that allows users to utilize, create and share maps, scenes, applications, layers, analytics and data - https://doc.arcgis.com/pt-br/arcgis-online/reference/what-is-agol.htm. ↩︎
Eades, G., Zheng, Y. (2014). “Counter-mapping as assemblage.” In B. Doolin, E. Lamprou, N. Mitev & L. McLeod (Eds.). Information Systems and Global Assemblages: (Re)Configuring Actors, Artefacts, Organizations . pp. 79–94. Berlin: Springer. ↩︎
Monteiro, M. (2015). “Construindo imagens e territórios: pensando a visualidade e a materialidade do sensoriamento remoto” . História, Ciências, Saúde – Manguinhos, Rio de Janeiro, v.22, n.2, abr.-jun., pp.577-591. ↩︎
Dávila, P. (2017). Visualization as assemblage: Exploring critical visualization practice. Information Design Journal, v. 23, n.1, pp. 19–31. ↩︎
Craig, W.J., T. Harris and D. Weiner, eds. 2002. Community Participation and Geographic Information Systems , New York: Taylor Et Francis. ↩︎
Sheppard, E. (2008). “Produção de conhecimento através do Sistema de Informações Geográficas Crítico: genealogia e perspectivas.” In: Acselrad, H. (Org.). Cartografias Sociais e Território . p.113-151. ↩︎
The group set up committees that have been working towards the identification of which governmental institutions produce geospatial data in the region, their lineage, scale and metadata, discussing their use for recurrent issues in the region such as EEZ revisions, Conservation Units management plans, directory plans and, more recently, the urban mobility plan. See in Working Groups at http://wiki.ubatuba.cc/doku.php?id=linda:lindageo. ↩︎
The strategy is to identify and request that scientific results be placed on a platform that is accessible to the whole community. View at scientific publications on the Northern Coast of São Paulo. http://wiki.ubatuba.cc/doku.php?id=linda:trabalhos_cientificos_lnsp. ↩︎
Latour, B. (2000). Ciência em Ação: como seguir cientistas e engenheiros sociedade afora . São Paulo: Editora Unesp. ↩︎
Concar - Comissão Nacional de Cartografia (2010). Plano de Ação para Implantação da Infraestrutura Nacional de Dados Espaciais . Brasília: Ministério do Planejamento, Orçamento e Gestão. 205 p. Disponível em: http://www.concar.gov.br/pdf/PlanoDeAcaoINDE.pdf. Acesso em 4 maio 2018. ↩︎
MMA – Ministério do Meio Ambiente (1997). “Detalhamento da Metodologia para Execução do Zoneamento Ecológico-Econômico pelos Estados da Amazônia Legal” . Brasília: MMA, Secretaria de Coordenação da Amazônia – SCA, Secretaria de Assuntos Estratégicos da Presidência da República – SAE/PR. ↩︎