An analysis of the user and image networks of deviantART, a report on named-entity extraction reliability for historical data from messy texts, and an attempt to chart the growth of cultural complexity using Google Ngrams.
Exploring Originality in User-Generated Content with Network and Image Analysis Tools#
Almila Akdag (view abstract, video of the presentation)
Akdag presented on a project she has been involved in with Lev Manovich and other collaborators, where they are working out conceptual and technical tools for evaluating art and related social networks. In particular, they are looking at deviantART; the site has been around for quite a while and has a very large user community, so it gives them plenty of interesting data to work with. The site includes “daily deviations”, which are a selection of 20-30 pieces displayed on the home page; the pieces are chosen carefully to try to keep a balance (for instance, a mix of new and old users); users can “favorite” other pieces, which Akdag describes as a kind of “self-curation” because at the click of a button you can add content to your own gallery. Each image has a page, so there is information about per-image views, comments, favorites, etc. When users add images, they are required to add category; the site doesn’t have a batch upload feature, which forces users to enter metadata for each individual item. Akdag noted that they are working with a clean subset of the deviantART data, which they have gotten from the site owners but can’t share.
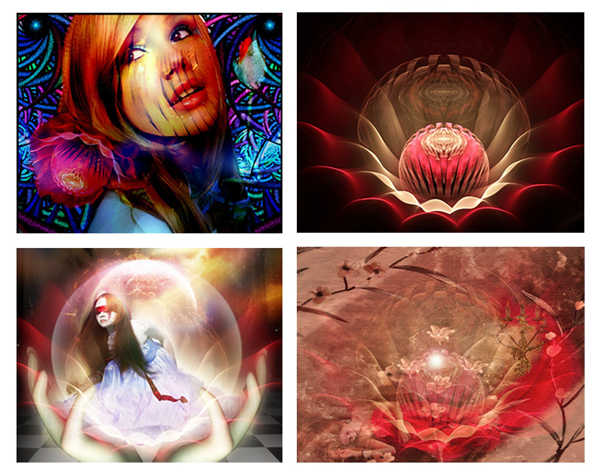
In this project, they are working with Everett Rogers’Diffussion of Innovation Theory for information flow in networks. It is difficult to define or measure originality, creativity, or innovation in terms of art; however, it is much more feasible to track something like a new idea, method or device. deviantART has a “resources” category that provides interesting data for this purpose; this category consists of stock images that are made available for re-use, as well as artists describing their techniques. Initially they thought they would use image analysis to trace image re-use, but recognizing the original image isn’t so easy to do (even for the human eye– see the example to the right). Akdag commented that the Histogram of Oriented Gradients (HOG) algorithm, which is state of the art for images (e.g., used in the Google image search for pictures with certain features), works well for generic items but does not work for identifying a specific image or item, which might be rotated or altered. However, when looking at the data they found that usually people leave a comment on the item page when they use something, so instead of using image analysis they ended up using text analysis to find related images.
Akdag showed a graph of the number of uploads (i.e., usages) after a popular tutorial is published, and to my untrained eye it looks pretty similar to the S-curve expected by Rogers’ Diffusion of Innovations theory. She also showed off a network graph based on the analysis of resource images which shows some interesting (although perhaps not entirely unexpected connections). Unfortunately, she ran out of time and had to gloss over some sections of her presentation, so I will have to keep an eye out for her further work to see what else they are coming up with.
Information Extraction on Noisy Texts for Historical Research#
(view abstract, video of the presentation)
This presentation was related to the work that EHRI (European Holocaust Research Infrastructure) is undertaking in an attempt to address the fragmentation and dispersal of archival sources for the Holocaust, working to bring multiple separate collections together into a “virtual observatory.” Their plan is to combine archival Finding Aids from a number of different archives, machine-generated extracted entities, and user annotations. They want to provide services to their partner archives, such as OCR to digitize paper finding aids (some archives have EAD xml, but others don’t), or Named Entity Recognition integrated with an EHRI thesaurus of names and places. The current work is building on past projects, e.g. Ocropodium, a web-based OCR tool with a customizable workflow, which uses tesseract OCR internally and allows annotation based on entities from DBpedia.
They presented their findings based on two different test cases on content they OCRed with 93% accuracy, working to extracting person, location, and organization terms with a number of different tools (AlchemyAPI, OpenCalais, Apache OpenNLP, Stanford Named Entity Recognizer (NER)), comparing against manual annotation to benchmark their results. They found the performance was not that great (the highest was a 0.54 F1 score with Stanford NER; OpenNLP performed the worst). Location data was the most successful, perhaps because it is the most stable and still much the same now. There were several issues with recognizing person names, e.g. dealing with non-standard or inconsistent forms; the tools they tested with were not context-aware enough to disambiguate people names from other types of names, like those of warships (a commenter in the Q&A session suggested that they should look to partner with an NLP specialist, and that identifying warship names would be an interesting problem). They found that recognition for organizations was extremely low, most likely due to the many non-standard forms and the fact that many of the historical organizations referenced no longer exist.
This is interesting work, and potentially very applicable to other digital library work, and there are also points of overlap with my own upcoming DiSC project. One of the commenters noted in passing that some of their tools were generating “irrelevant” results, which is an interesting problem; they are working within a particular domain of historical data, but there isn’t really any way currently to constrain the NLP tools based on that information. It seems like a more generic way of constraining or informing the results based on a particular domain or field would be interesting for a wide range of projects.
Using the Google Ngram Corpus to Measure Cultural Complexity#
Patrick Juola (view abstract, video of the presentation)
Juola opened his presentation by talking about language and culture change, and his attempt to figure out how we can measure it. He referenced his prior work on linguistic complexity, which he says can be measured by comparing compressed translations of the same work (e.g., something like Tolkien’s Lord of the Rings). He says that all languages are equally complex, but that some have more morphological complexity, while others have more syntactic complexity; he also noted that translations always increase complexity, because the translator has to add more background and context, which may make translations of works useful as a measure of cultural similarity.
From there, Juola shifted from talking about language to culture, which he distinguished as “how we say things” vs. “what we talk about.” He described how he started with the intuition or guess that culture is cumulative, so it should increase over time, except for special circumstances. For his data, he used Google Ngrams to calculate the change in bigram types (i.e., the number of newly added bigrams) as well as the change in Shannon entropy (how much information is present). He demonstrated that according to his data, bigram types dip in the 1930s, but entropy does not (both have a generally upward trend), and speculated that the dip in bigram types may relate to a decrease in publishing during the Great Depression. He noted that books often include quotes or influence from the previous year, so both of these measures should naturally increase. He also suggested some possibilities for developing this work further, such as looking at the rate of change, cross-cultural change, or perhaps investigating unigrams instead of bigrams; another approach would be to identify historical events that should show up in the data if this model is at all correct. He concluded by claiming that he has come up with a novel definition of cultural complexity, a novel metric, and preliminary results that at least support his initial intuition.
Juola seemed to meet with some amount of resistance from the audience (I think that perhaps he was intentionally being provocative, e.g. with his very loose definition of culture). There were several concerns from commenters about the sample size, the data set (Juola’s numbers were only based from one year each decade rather than each year); another respondent asked if growth in vocabulary or increased diversity (e.g., in the variety of first and last names) really constitute a growth in cultural complexity.