A session on three different geographical or otherwise map-related projects: applying 3D technologies to archaeology, investigating the precision of Ptolemy’s maps, and the new map-making tool Neatline from UVA Scholar’s Lab.
The MayaArch3D Project: A 3D GIS Web System for Querying Ancient Architecture and Landscapes#
presented by Jennifer von Schwerin (view abstract, video of the presentation)
This project combines 3D models, virtual reality, GIS and archaeology into the “QueryArch3D” prototype (see http://mayaarch3d.unm.edu/ for more details, a demo video, etc).
von Schwerin tells us that Mayan architecture is a particularly good case study, since archaelogists can track the architecture to the decade. As part of this project, they have created 3D models with tools like SketchUp as well as “reality-based” models generated by laser scanning. However, the reality-based scans are too complex and large for most uses (e.g., fast rendering in a virtual reality interface or game engine), and there are also copyright issues.
One of the goals of this project is to allow spatio-temporal analysis - e.g., to be able to investigate according to access, visibility, orientation; whether that of buildings, landscapes, ritual places and pathways, or even the stars for “archaeoastronomy” (that sounds like such a great subfield/specialization). They looked at using GIS for this, but GIS is “2½D” because it was designed for terrain models, and existing 3D GIS is limited. Instead, the current prototype using the Unity3D game engine along with more standard web technologies (PHP, PotGres, PostGIS) to link up metadata, images, and the more detailed scans.
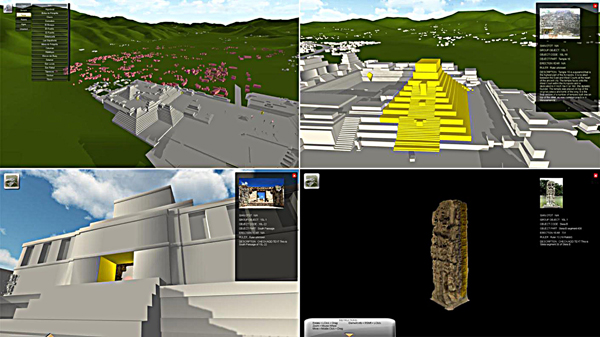
von Schwerin noted that it requires team collaboration to do this, and there are still some other issues: it is expensive to do 3D, and there are concerns about how “future proof” this approach is. One respondent at the session (who apparently is doing somewhat similar work) asked if there isn’t a fundamental issue with using a game engine, referring in particular that it is closed source. I wonder if it isn’t bigger than that, though, since games engines are intended for something rather different than this. During the presentation von Schwerin showed off some demos of the prototype, and while I know what they have done is very complex and scholarly based and impressive, I still have to wonder how long people will put up with blocky, untextured models of history buildings when we have gotten so spoiled with the amazing CGI in current video games and movies. I don’t think I’d heard the distinction between 3D models and “reality-based” scans before; I’m pretty sure I’ve read that the Microsoft Kinect can be used for 3D scanning, and while I don’t know if it would be applicable to the architecture and art they are working with, it does make me think that perhaps there will be a middle-ground solution between the expensive laser scans and the manually created models.
Ptolemy’s Geography and the Birth of GIS#
Leif Isaksen (view abstract, video of the presentation)
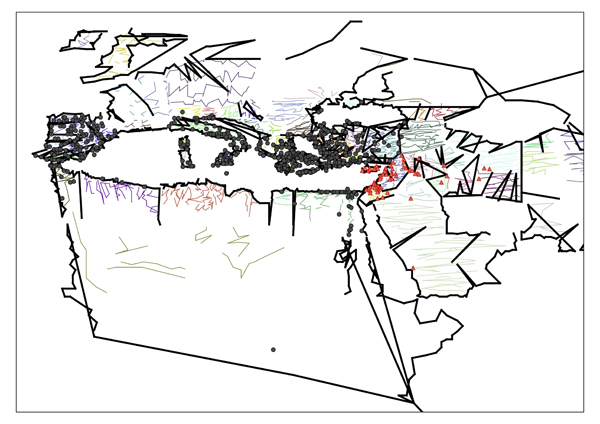
Isaksen started by saying that the other title for his talk was “New Perspectives on the pre-history of the map,” and then dove into a discussion of Claudius Ptolemy’s Geographike Hyphegesis as a manual for producing a map of the world, a text that is practical but also theoretical. Isaksen explained Ptolemy’s differentiation of “chorography” and “geography” - regional, drawn,and imprecise vs. a mathematical, precise representation of the world, and then took us through the precision distribution of Ptolemy’s maps. Isaksen has mapped Ptolemy’s coordinates to determine the relative precision of them, and if there is any logic or correlation to high precision values, and discovered that the precision is higher on the coast, nearby and less precise further out, but there are also certain regional areas or sections of higher precision, which suggests at some of the different sources Ptolemy drew on (even apparently including “chorographic” sources).
It wasn’t the focus of the presentation, but I particularly liked the way Isaksen introduced Ptolemy; as one of the most significant figures in the history of science, with influence in the fields of cosmology, geography, astrology, harmonics and optics, we tend to think of him as a polymath. Isaksen says that Ptolemy probably just considered himself a cosmologist, and everything else he did was related to that for him. It makes me think of the fields and pursuits we draw distinctions between or think of as totally foreign, and makes me curious what future generations will think of the ways we divide or unite our scholarly work.
Geo-Temporal Interpretation of Archival Collections using Neatline#
Bethany Nowviskie, David McClure, Graham Wayne, Jeremy Boggs, Eric Rochester (view abstract, video of the presentation)
A demonstration of the new mapping tool from Scholars’ Lab, Neatline. Nowviskie noted a couple of interesting decisions relating to the project development. They made a pragmatic decision: initially this was conceived as a stand-alone tool, but instead they decided to shift to a set of mix-and-match modules for use with Omeka. They also made a deliberate conceptual decision, which was to design the tool in a way that would promote a more “hand-crafted” visualization, rather than just auto-populating a map or a timeline with all available data, as is often so easy to do with other tools. After some background, they showed off the tool using the Battle of Chancellorsville demo map, which integrates timelines, a historic map which has been geographically keyed, and annotations. In one part of the demonstration they even showed off a version of the map where they had overlaid sketches of the battle from an eye-witness account in a diary or a letter. What they’ve done here is impressive, and this demonstration map is really quite beautiful; I’ll be curious to see what others do with it. To my mind, it’s a bit unfortunate that Neatline can only be used with Omeka, since we’re really not using it (and I’m unimpressed with the technology underneath); but perhaps even if we can’t use it directly we can still keep the ideas and principles of their approach in mind.