This was a diverse session– from detailed visual analysis of title pages in 17th century medical texts, to the failure of traditional keyword analysis methods with authors like Dickens, to “macroanalysis” across some 3,500 19th century literary texts.
Culpeper’s legacy: How title pages sold books in the 17th century#
Tyrkkö, Jukka Jyrki Juhani; Suhr, Carla Maria; Marttila, Ville (view abstract, video of the presentation)
This study was done as part of the larger Gatekeepers of Knowledge project (considering printers, publishers, book sellers, and authors as those gatekeepers), working within the realm of historical pragmatics. This study was done as a pilot to determine and test out a process and annotation methods.
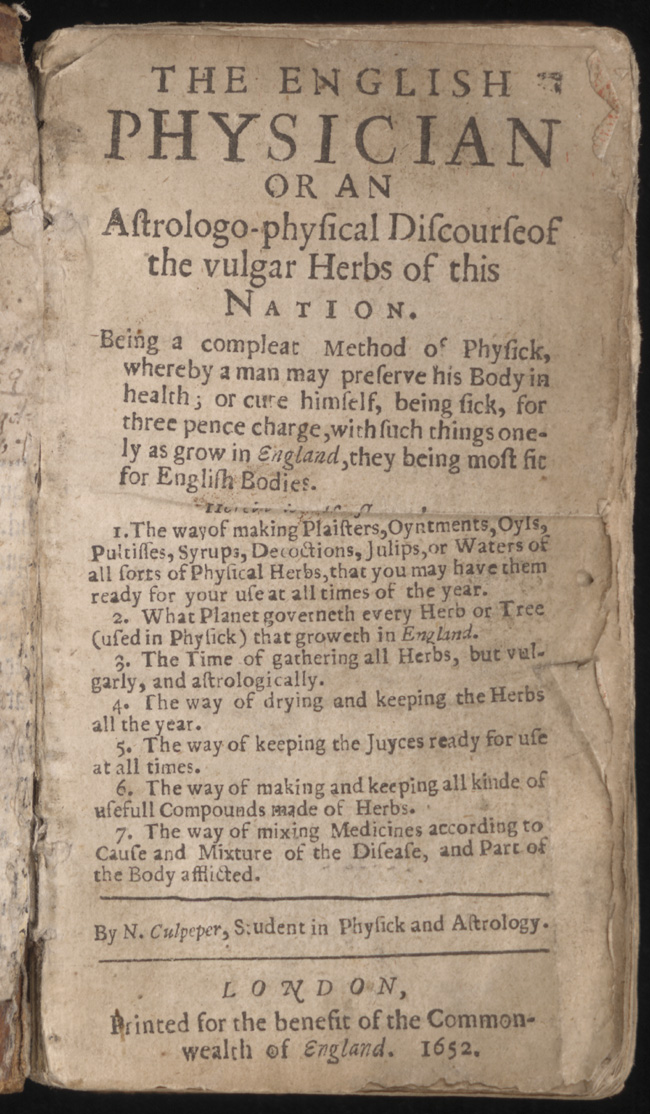
Title pages in this time period are well-known and documented as being effectively advertising (even to the point of passing out copies of title pages as flyers in bookstores). In this project, they worked with 95 title pages in an attempt to identify a Culpeper “brand”, and also looking to confirm other scholarly findings. They marked up their title pages in such detail that the visual layout of the page can be reproduced visually via XSLT or be queried forcombinationsof typographical features and content, in order to allow comparing books by different publishers during and after Culpeper’s life. Their findings were that the unauthorized printers tended to use larger versions of Culpeper’s name, more font types, increased title length, and even citing Culpeper as an authority (which the authorized Culpeper texts did not do).
Comments after the presentation focused on the “notoriously difficult” task of encoding for visual difference; e.g., relative vs. absolute sizes; they measured font sizes manually, but not to an exact measurement - so they were careful to use sizes only for comparison. They also used the TEI <space> tag to encode document layout, which gives the potential to analyze emphasis created by white space on the page, although they aren’t doing this. I myself find it hard to believe they annotated even 95 title pages by manually measuring the sizes of fonts and spaces (they handed out little plastic mini-rulers at their talk), because that sounds incredibly tedious; it seems like there must be faster and easier ways of doing this (e.g., xml OCR output such as that provided by ABBYY Fine-Reader, which includes font sizes and placement), although perhaps those methods were not accurate enough for the purposes of this project.
Approaching Dickens’ Style through Random Forests#
Tomoji Tabata (view abstract, video of the presentation)
Tabata started by noting that Dickens is considered a “linguistic innovator”, and cites a quote from Our Mutual Friend, that “ours is a copious language”; which makes Dickens an interesting case for author analysis. Tabata proceeded to identify some problems with the keyword-based analysis that is commonly used for genre and author studies, particularly as applied to a comparison between Dickens and Wilkie Collins - it picks up character names that are repeated frequently in a single text, because they have a “peculiar distribution”, but these names are obviously not applicable to any other texts. There are techniques to address this by “culling” inappropriate values, but that risks a loss in accuracy or “explanatory power.” Instead, Tabata applied the machine learning technique of “random forests”, which uses randomly selected terms to generate classification trees (hence, a forest full of trees). After a high-level overview of the process he used, Tabata gave some specific examples from his analysis; for instance, the word “saw” has absolutely no indicator power between Collins and Dickens in standard keyword analysis, but it is significant in random forests. Another case is the Dickens phrase “with his hands in his … " (usually pockets); Dickens didn’t invent this phrase, but he was an early adopter and used it often for characterization. I particularly liked the way Tabata started and ended with the language and the text, explaining quite clearly the analytical process and motivation in between.
Computing and Visualizing the 19th-Century Literary Genome#
Matthew Jockers (view abstract, video of the presentation (MOV))
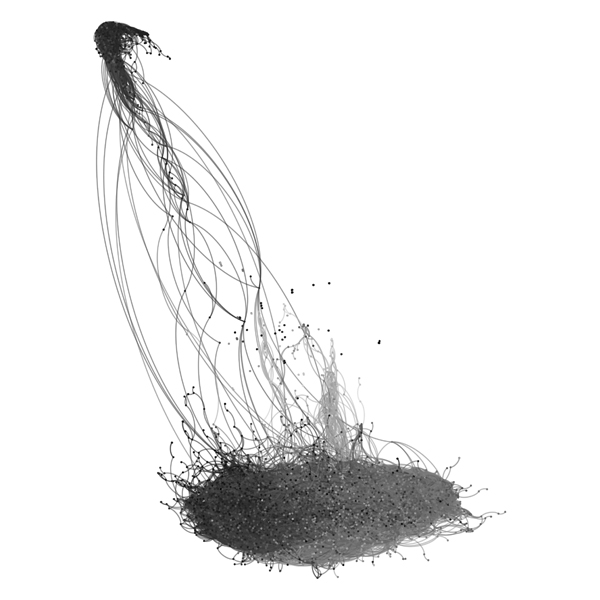
Jockers presented (virtually, via video) on a part of his “macroanalysis” project, looking at literary influence across ~3,500 19th century texts, using topic modeling (with the texts split into chunks so that the topics don’t get washed out), keyword and punctuation feature extraction, and parts-of-speech and named entity extraction (for non-personal nouns only) in order to plot texts and diagram “stylistic and thematic distance.” He displayed some interesting images with graphs of “influence” as he is tracking it (although, the graphs used in the talk seemed quite different from those included in the abstract); the results of these themes can be viewed on Jockers’ website. Jockers claims that his macroanalysis should identify or highlight outliers, which would lead scholars to investigate why something might be an outlier - especially if we find unexpected or unexplained outliers which might cast doubt on either the method or traditional literary scholarship. He did note that “canonical greats are not outliers,” which seems rather contradictory to the claim in the abstract that “a great many of the individual books we have traditionally studied are in fact ‘mutations’ or outliers from the general trends.” Some of the commenters pointed out that because Jockers has restricted “influence” in one direction (i.e., he assumes only works published before the current one can influence it - an assumption that is further muddied by date discrepancies between publication and actual authorship, or groups of authors sharing ideas and drafts of in-progress work), his graph naturally has to shift generally from gray to black; perhaps if he were looking at relatedness instead of influence we would see something different (suggesting that the graph is a result of assumptions). However, the fact that are still some outliers in the current graph does seem interesting. Another person asked if there was any obvious relationship between books by the same author, noting that if they do cluster according to this ‘macroanalysis’, that it might be a kind of validation of the method.